Last updated: 27 January 2026
Literacy rates in the UK
Literacy is the ability to read, write, speak and listen in a way that lets us communicate effectively and make sense of the world.
- 1 in 6 in England have poor literacy
- 1 in 4 in Scotland lack literacy
- 1 in 8 in Wales lack basic literacy
- 1 in 5 in N. Ireland have poor literacy.
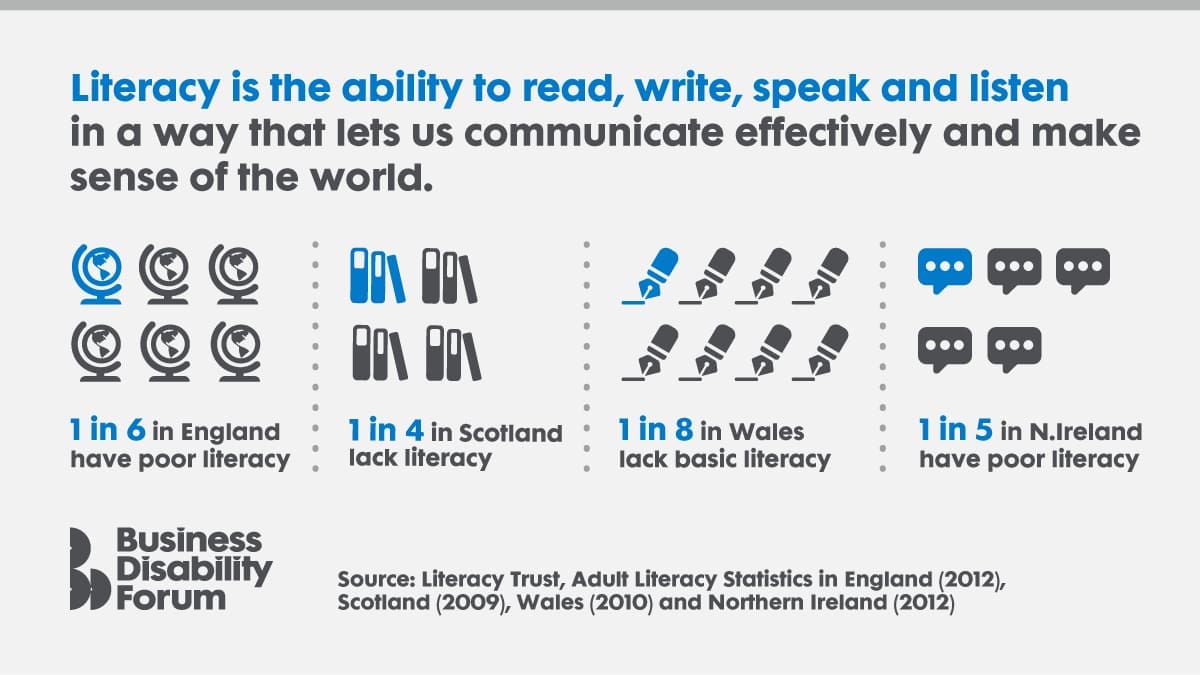
Source: Literacy Trust, Adult Literacy Statistics in England (2012), Scotland (2009), Wales (2010) and Northern Ireland (2012).
Representation of disability
Disabled people appear in less than 2 per cent of the images we see in the media.
7 out of 10 people say they feel more positive towards brands that include disabled people in their advertising.
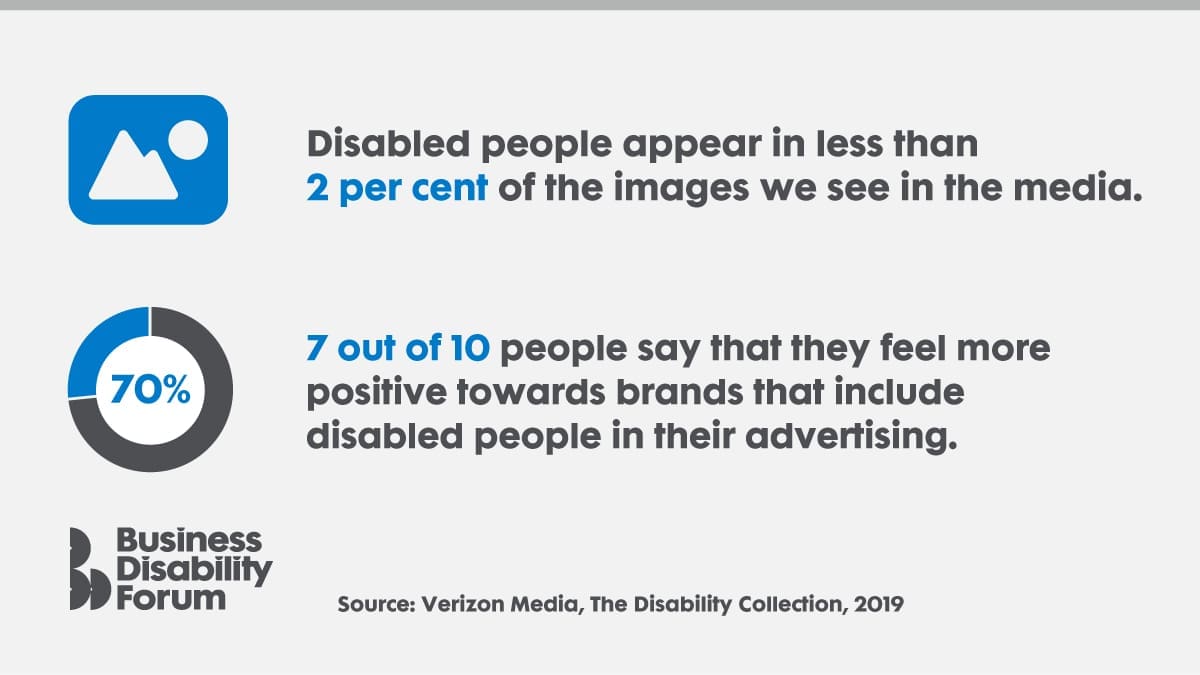
Source: Verizon Media, The Disability Collection, 2019.
Rates of disability worldwide
More than 1 billion people (15%) in the world have a disability.
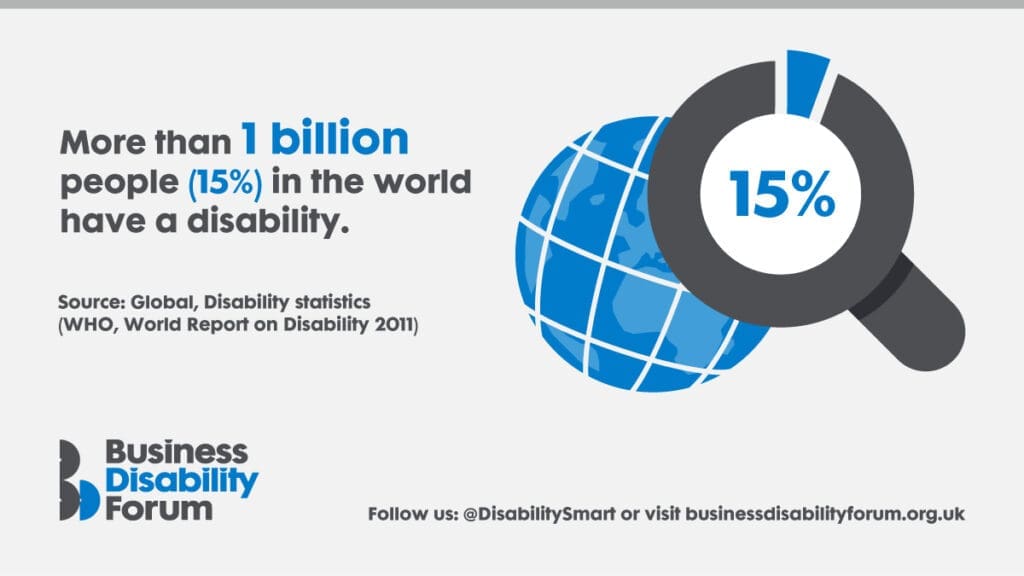
Source: Global, Disability statistics (WHO, World Report on Disability 2011).
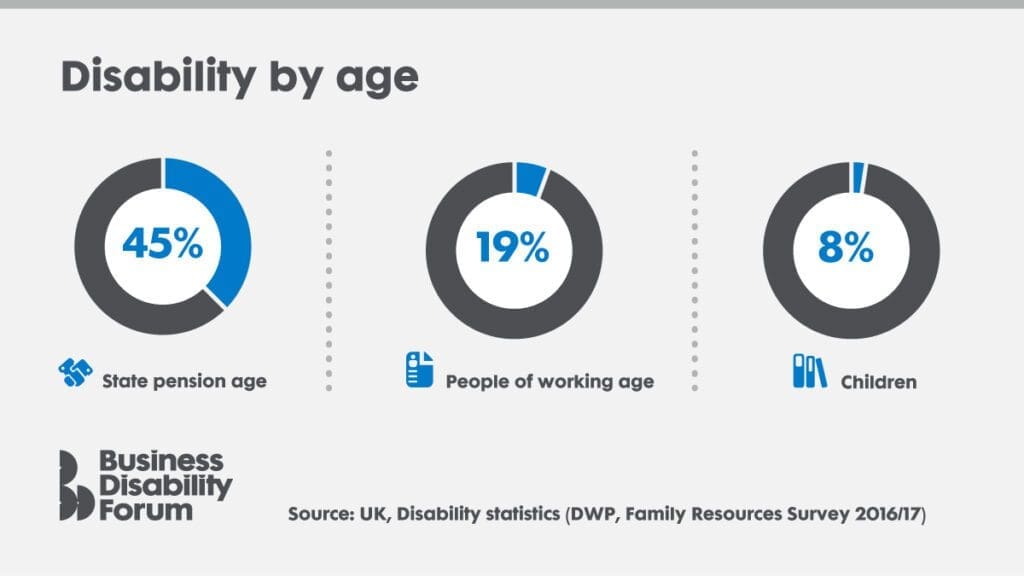
Rates of disability in the UK
1 in 5 people in the UK has a disability.
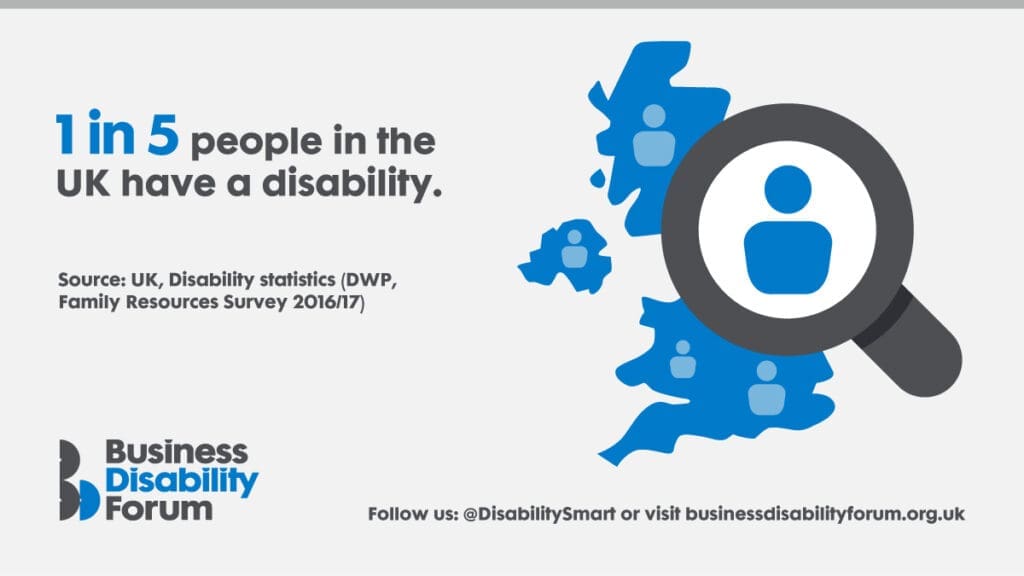
Source: UK, Disability statistics (DWP, Family Resources Survey 2016/17).
More people are becoming disabled
The number of people living with a disability is increasing. Key reasons include:
- Ageing population
- Increase in chronic health conditions.

Source: Global, Disability statistics (WHO, World Report on Disability 2011).
Internet usage
The number of disabled people using the internet is increasing. It was 10 million in 2019, and 11 million in 2020.

Source: UK, Disability statistics (ONS, Internet users UK: 2020).
Internet usage gap
The percentage of disabled people using the internet is lower than non-disabled people. 81 per cent of disabled adults use the internet, compared with 92 per cent of non-disabled adults.
Source: UK, Disability statistics (ONS, Internet users: 2020).
Spending power of disabled people
The annual spending power of families with one disabled person is estimated to be £274 billion.


Source: UK , Disability and spending (DWP, Household below average income: 1994/95 to 2017/18).
Finding the right information
At least seven in ten disabled consumers stated that their disability or access needs had made finding the information they needed more difficult in the following sectors:
- New places to eat out (75 per cent)
- Days out and leisure (78 per cent)
- Holiday accommodation (73 per cent)
- Banking and insurance services (70 per cent).

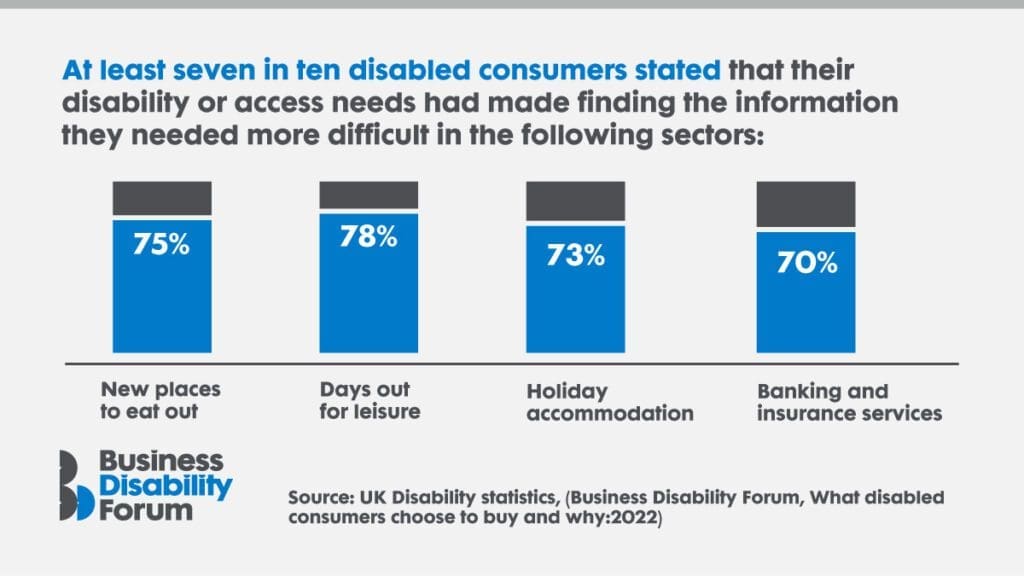
Source: UK, Disability statistics (Business Disability Forum, What disabled consumers choose to buy and why: 2022).
Communication preferences
Disabled consumers want choice in how they communicate with businesses. Survey respondents indicated the following communication preferences:
- Email (66 per cent)
- Telephone (52 per cent)
- Face-to-face (52 per cent)
- Webchat (32 per cent)
- Text (17 per cent).
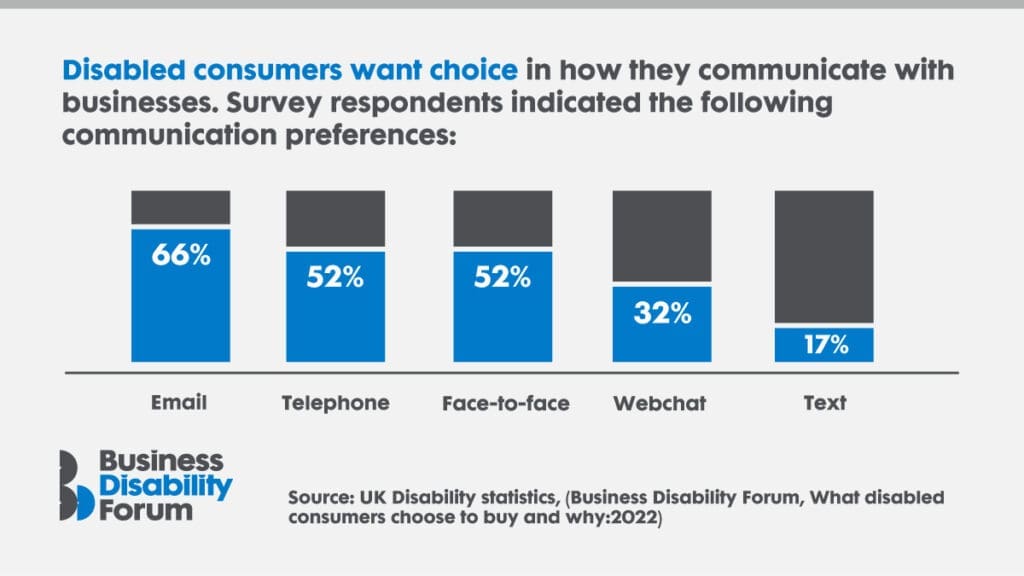
Source: UK, Disability statistics (Business Disability Forum, What disabled consumers choose to buy and why: 2022).
If you require this content in a different format, contact [email protected].
© This resource and the information contained within it are subject to copyright and remain the property of Business Disability Forum. They are for reference only and must not be copied or distributed without prior permission.